Menu Navigation
Reports ... Report Explorer
Reports ... Favorite Reports ...
About Reports
ManageMore includes hundreds of reports and charts that most businesses find useful. These reports are organized and run using our unique Report Explorer screen (see Figure 2-15). This one window allows you to find and select any standard report or chart, create favorite reports, and create and run custom reports.
In this Topic
Report Explorer
Report Criteria
Drill-Down Reports
Using Charts
Field by Field Help - Chart Options screen
Q & A - Reports and Charts
Related Topics
2.12 Creating Custom Reports
16.9 Lists and Labels
Report Explorer
The Report Explorer (see Figure 2-15), allows you to easily find the report you would like to run. The Categories list displays the available sections of reports. The categories are divided much the same way as the ManageMore menu. Your category list may be limited depending upon several factors: a) the Industry modules you have licensed and chosen in your company profile b) the general options you have selected in setup and c) user security as defined in the security administrator program.
To expand or contract a folder, click on the Plus [+] or Minus [-] next to the folder. You may also press the <space> key to expand and contract folders.
The Report Name list shows a list of reports available for the selected category. To switch focus between the two lists, press the <tab> key. You can also use the <up>, <down>, <left> and <right> keys to navigate the lists.
When you have found the report you would like to run, you can execute it by pressing <Enter>, or clicking on the Open / Run Report button. Alternately, you may double-click on the desired report name. When you select to run the report using one of these options you will be presented with the Report Criteria screen for the desired report (see Figure 2-16).
You can make one or more reports more easy to find and access, by adding them to your favorites list. To do so, highlight the desired report and click the Make Favorites button. This will add the report to the Favorites list appearing at the start of Report Explorer, and add the report to your Favorite Reports menu.
Report Criteria
The report criteria screen (see Figure 2-16) allows you to select the parameters for running your report, as well as the destination of your report data.
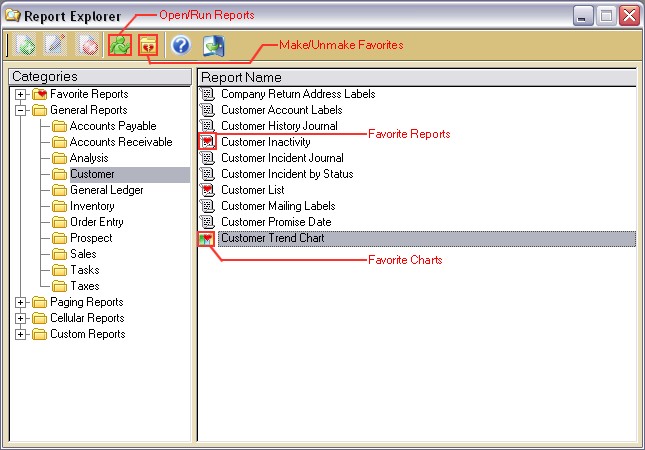
Figure 2-13. The Report Explorer screen
Drill-Down Reports
Drill-down reports allow you to double-click on a line in a report to view more detailed information, a specific transaction which contributes information to the report, and printing of the information just as in a traditional report. When the display of the drill-down report is run, the report output window will show up just as in opther reports, but a single click of the mouse will cause the underlying line to be highlighted. Double-clicking of the mouse will open the accompanying information for that report in a new window on top of the report. You can then puruse the information that is presented or close the window to view another report entry's source.
Using Charts
Charts allow you to see data quickly and easily through a pictorial view, rather than having to go through a sea of numbers. The charts found in the program allow you to get an overview of sales data, salesperson (your company) data and can aid in forecasting for your business. Each chart can be customized to fit your needs, including titles, captions, legends, and colors (see Figure 2-17).
Field by Field Help - Chart Options screen
Sample Chart
Displays a sample of the current chart with the options currently chosen.
Titles
Show Custom Chart Title
Select whether to customize the title of the chart currently being worked on. Selecting this option will enable the remainder of the options on this tab.
Chart Title
Enter a title for the chart currently being worked on.
Category (X) Axis
Enter a description that describes the values along the horizontal axis.
Value (Y) Axis
Enter a description that describes the values along the vertical axis.
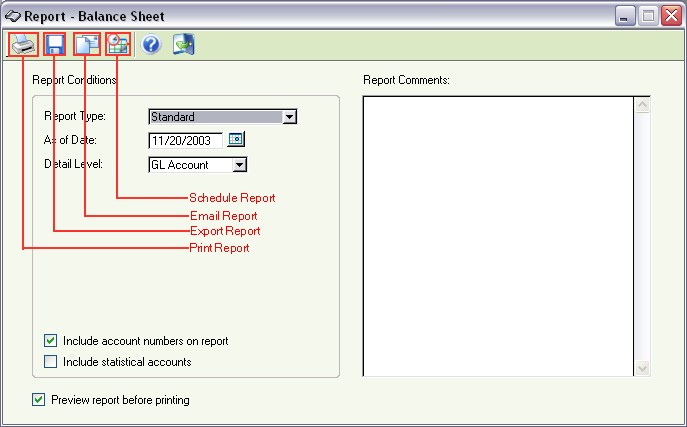
Figure 2-14. A Report Criteria screen
Axes
Axis Grid Style
Enter or select the style (color scheme) for the graph background of this report. Choose from 1 to 30.
Category (X) axis
Select whether to customize the manner in which the data labels are displayed along the horizontal axis. Selecting this option will enable the remaining (X) options.
(X) Position
Select the position of the X-axis labels. Choose from the Bottom/Left, or Top/Right.
(X) Justify
Select the justification (alignment) of each X-axis label. Choose from Left, Center, or Right.
(X) Font Angle
Select the angle between the horizontal axis and the X-axis data labels. Choose from 0 or 90 degrees.
Value (Y) axis
Select whether to customize the manner in which the data labels are displayed along the vertical axis. Selecting this option will enable the remaining (Y) options.
(Y) Position
Select the position of the Y-axis labels. Choose from the Top/Left, or Bottom/Right.
(Y) Justify
Select the justification (alignment) of each Y-axis label. Choose from Left, Center, or Right.
(Y) Font Angle
Select the angle between the vertical axis and the Y-axis data labels. Choose from 0 or 90 degrees.
Legend
Show Legend
Select whether the legend should appear on the chart. Selecting this option will enable the remaining options on this tab.
Legend Position
Select the position in which the legend should appear relative to the graph on the chart. Select from Top-Left, Top, Top-Right, Left, Right, Bottom-Left, Bottom, or Bottom-Right.
Legend Stacked
Select how the individual items are aligned within the legend. Choose from stacked (vertical) or inline (horizontal).
Legend Angle
Select the orientation of the legend. Choose from horizontal or vertical.
Data
Data Style
Enter or select the style (color scheme) for the data representations of this report. Choose from 1 to 12.
Show Data Labels
Select whether to show the actual data next to the corresponding representation in the graph.
Colorize Data Labels
Select whether to display the data labels in the same color scheme selected for the data style.
Shorten Data Labels
Select whether to display data in a shorter format, substituting K for thousand, M for million, etc.
| For example, selecting the "Shorten Data Labels" option in the previous selection will cause 2,283 to display as 2.2K.
|
Show percentages in Data Labels
Select whether to show the pie piece's data value as a percentage of the total. This option is only available on pie chart style charts.
Show actual values in Data Labels
Select whether to show the pie piece's actual data value on the chart. This option is only available on pie chart style charts.
Show category names in Data Labels
Select whether to show the category names that correspond with each pie piece in the chart. This option is only available on pie chart style charts.
Properties
Pattern
Select the pattern to be used for the bars or cylinders in a bar, column, cylinder, or line column chart.
Shape
Select the shape of the data points to be used in a line, scatter, or line column chart.
Background Color
Select the color for the background of the chart outside of the graph area.
Fill To Zero
This option will cause a line chart to appear as a solid area instead of a line. This option is only available on line charts.
Line Width
Select the width of the lines in a line, or line column chart in pixels.
Inner Radius (Doughnut)
Select the radius of the inner hole of the doughnut when creating a doughnut graph. The number selected represents the number of pixels for the radius of the inner hole.
Apply shading effect on all data points
Select whether shading should be applied to data points to give a 3-D look.
Apply shading effect from top to bottom
Select whether shading should be applied from top to bottom. Not selecting this will apply shading from left to right.
Q & A - Reports and Charts
| Q01. | Can I use the program while a report is running?
|
| A01. | Yes. While most reports only take a few seconds to run, others may be quite lengthy, depending upon the size of your database. You can always select other menu items/functions while a report is in progress, although there may be some performance degradation while running a report.
|
|
|
| Q02. | Why does my report preview show an incomplete page?
|
| A02. | The most likely cause is the lack of a printer driver installed on the computer you are using. You may also need to click on the Actual Size button in the preview window as this affects the way the report shows in the preview window.
|
|
|
| Q03. | How can I search for data in a report?
|
| A03. | On the preview window itself, a search entry field can be found at the top center of the screen. Matches to your search will result in tagged pages on screen. However, if you export the report to a PDF (Adobe Acrobat) file, the Acrobat viewer will allow the data in the report to be searched.
|
|
|
| Q04. | I don't see my question here. Where else can I get information?
|
| A04. | Visit our website's Technical Support section.
|
|
|